SUMMER SALE
Up to 40% off
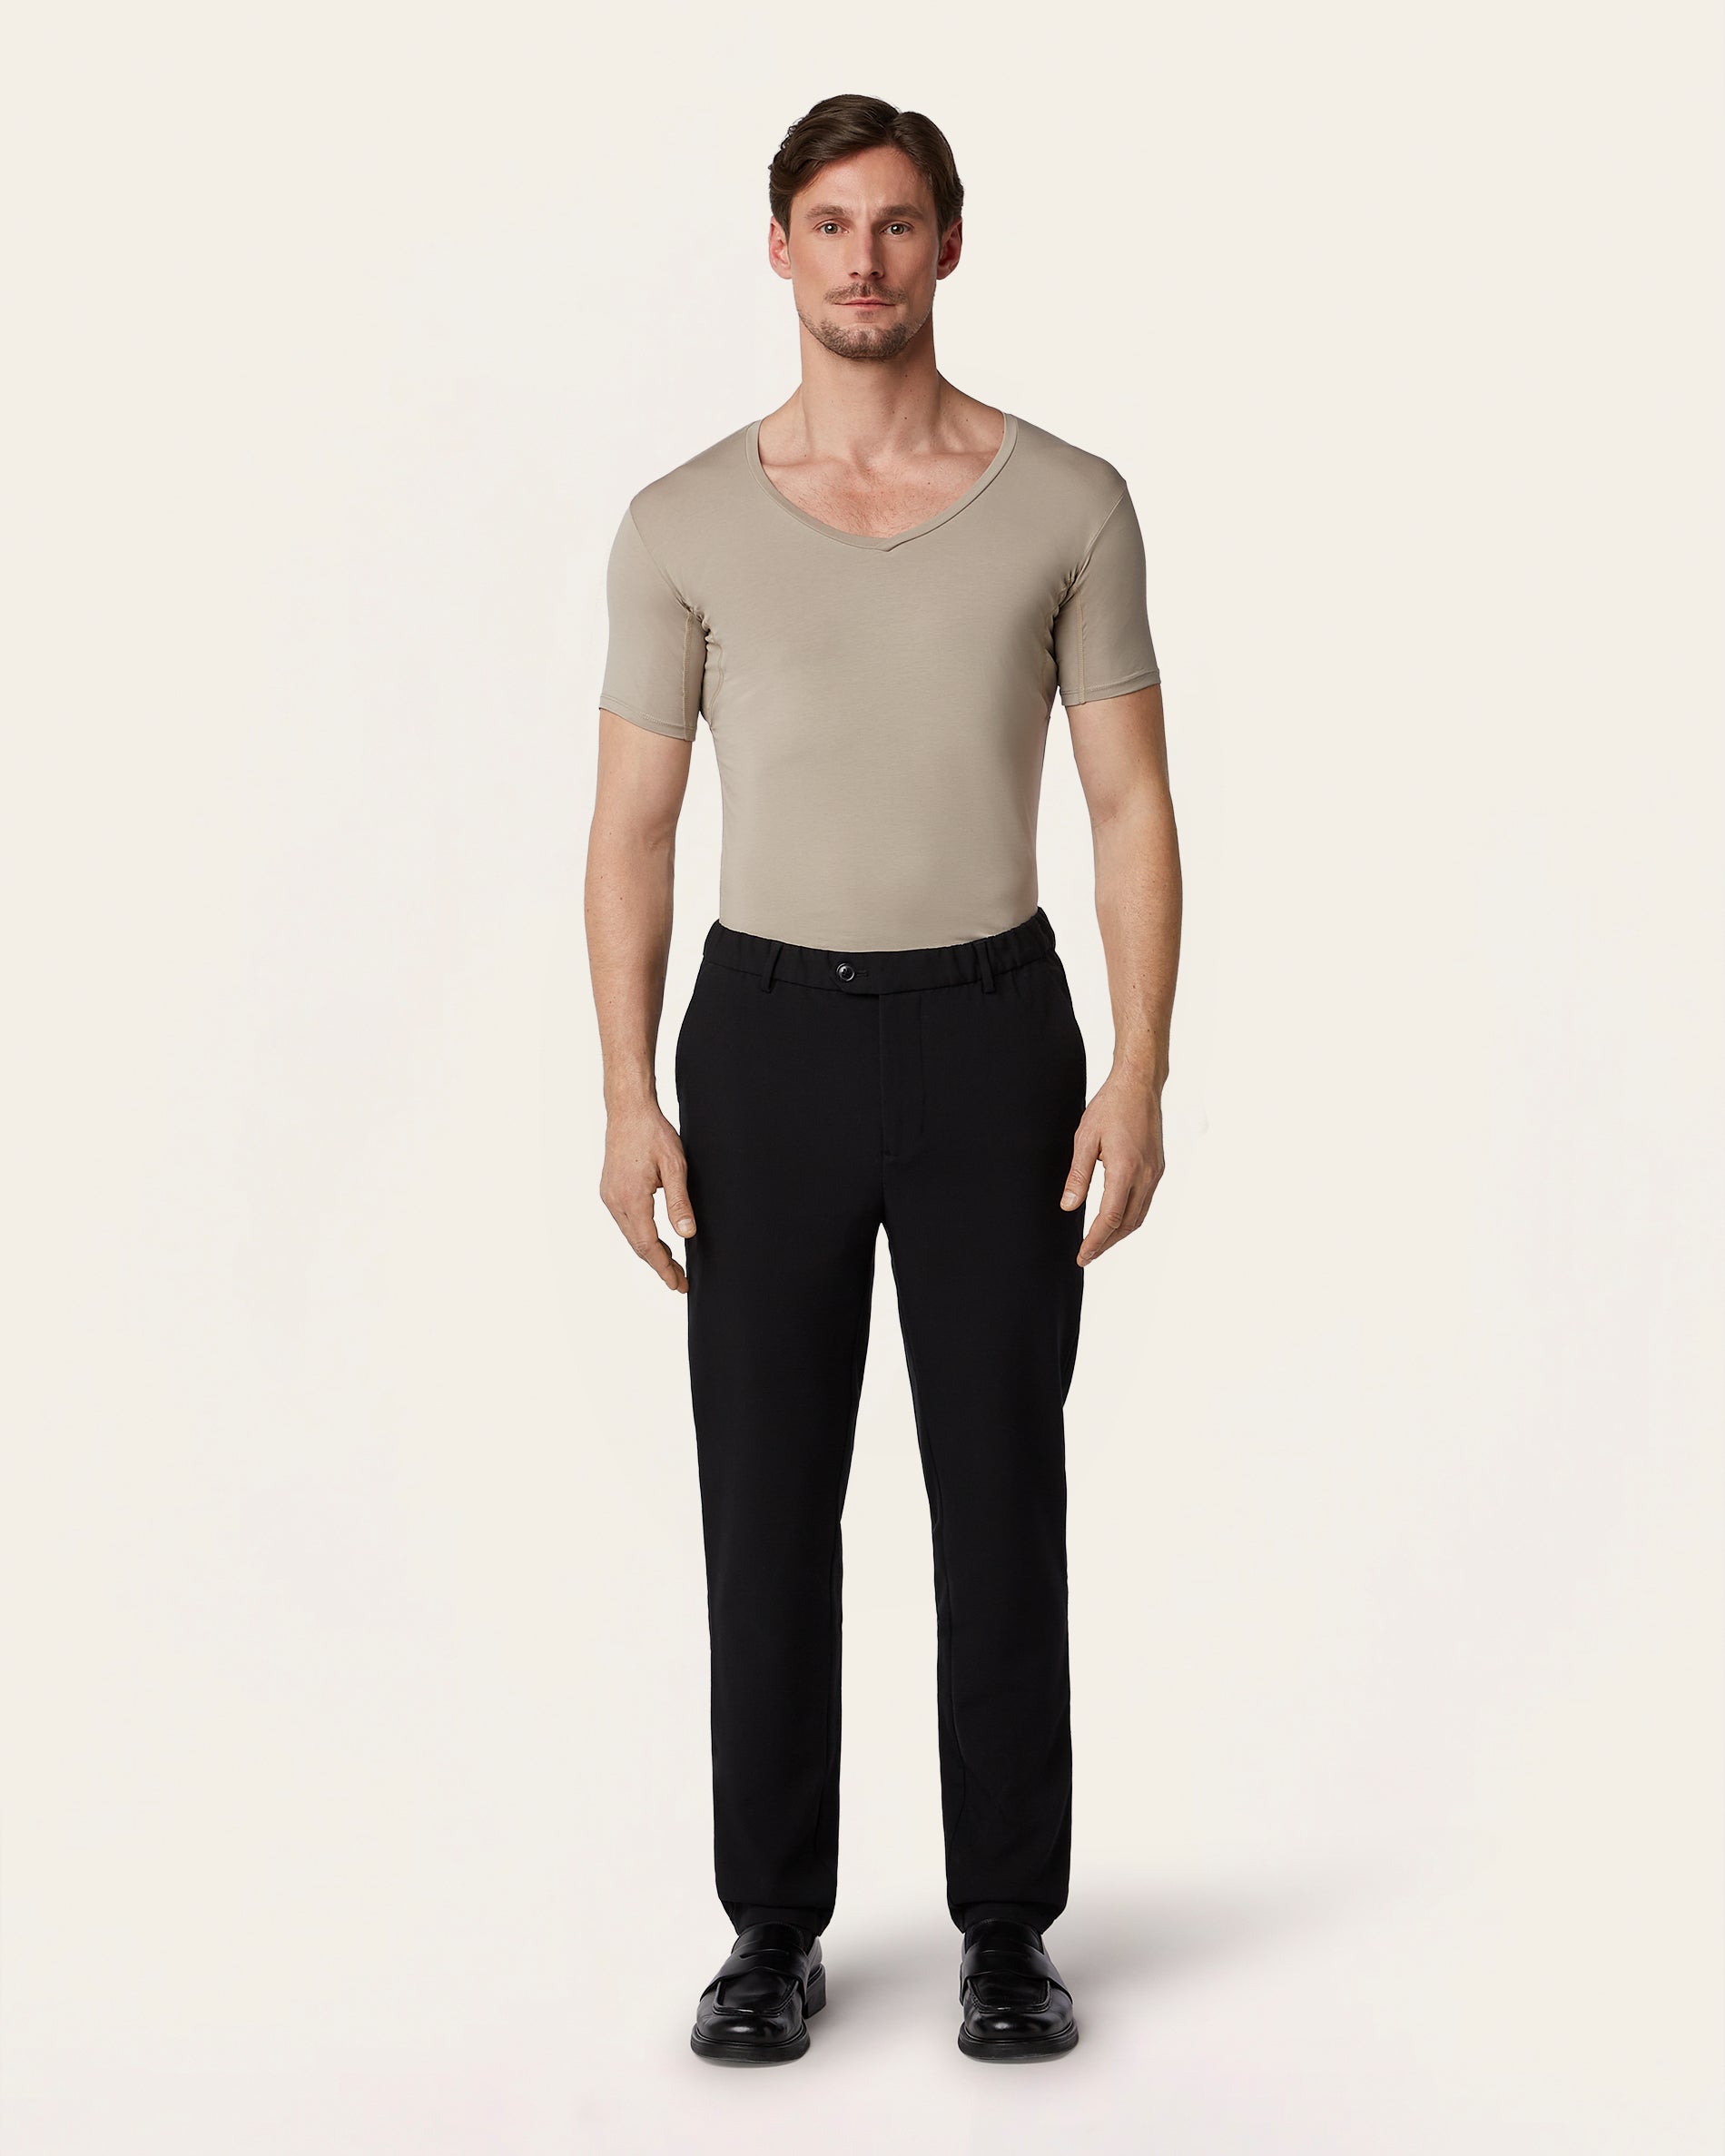
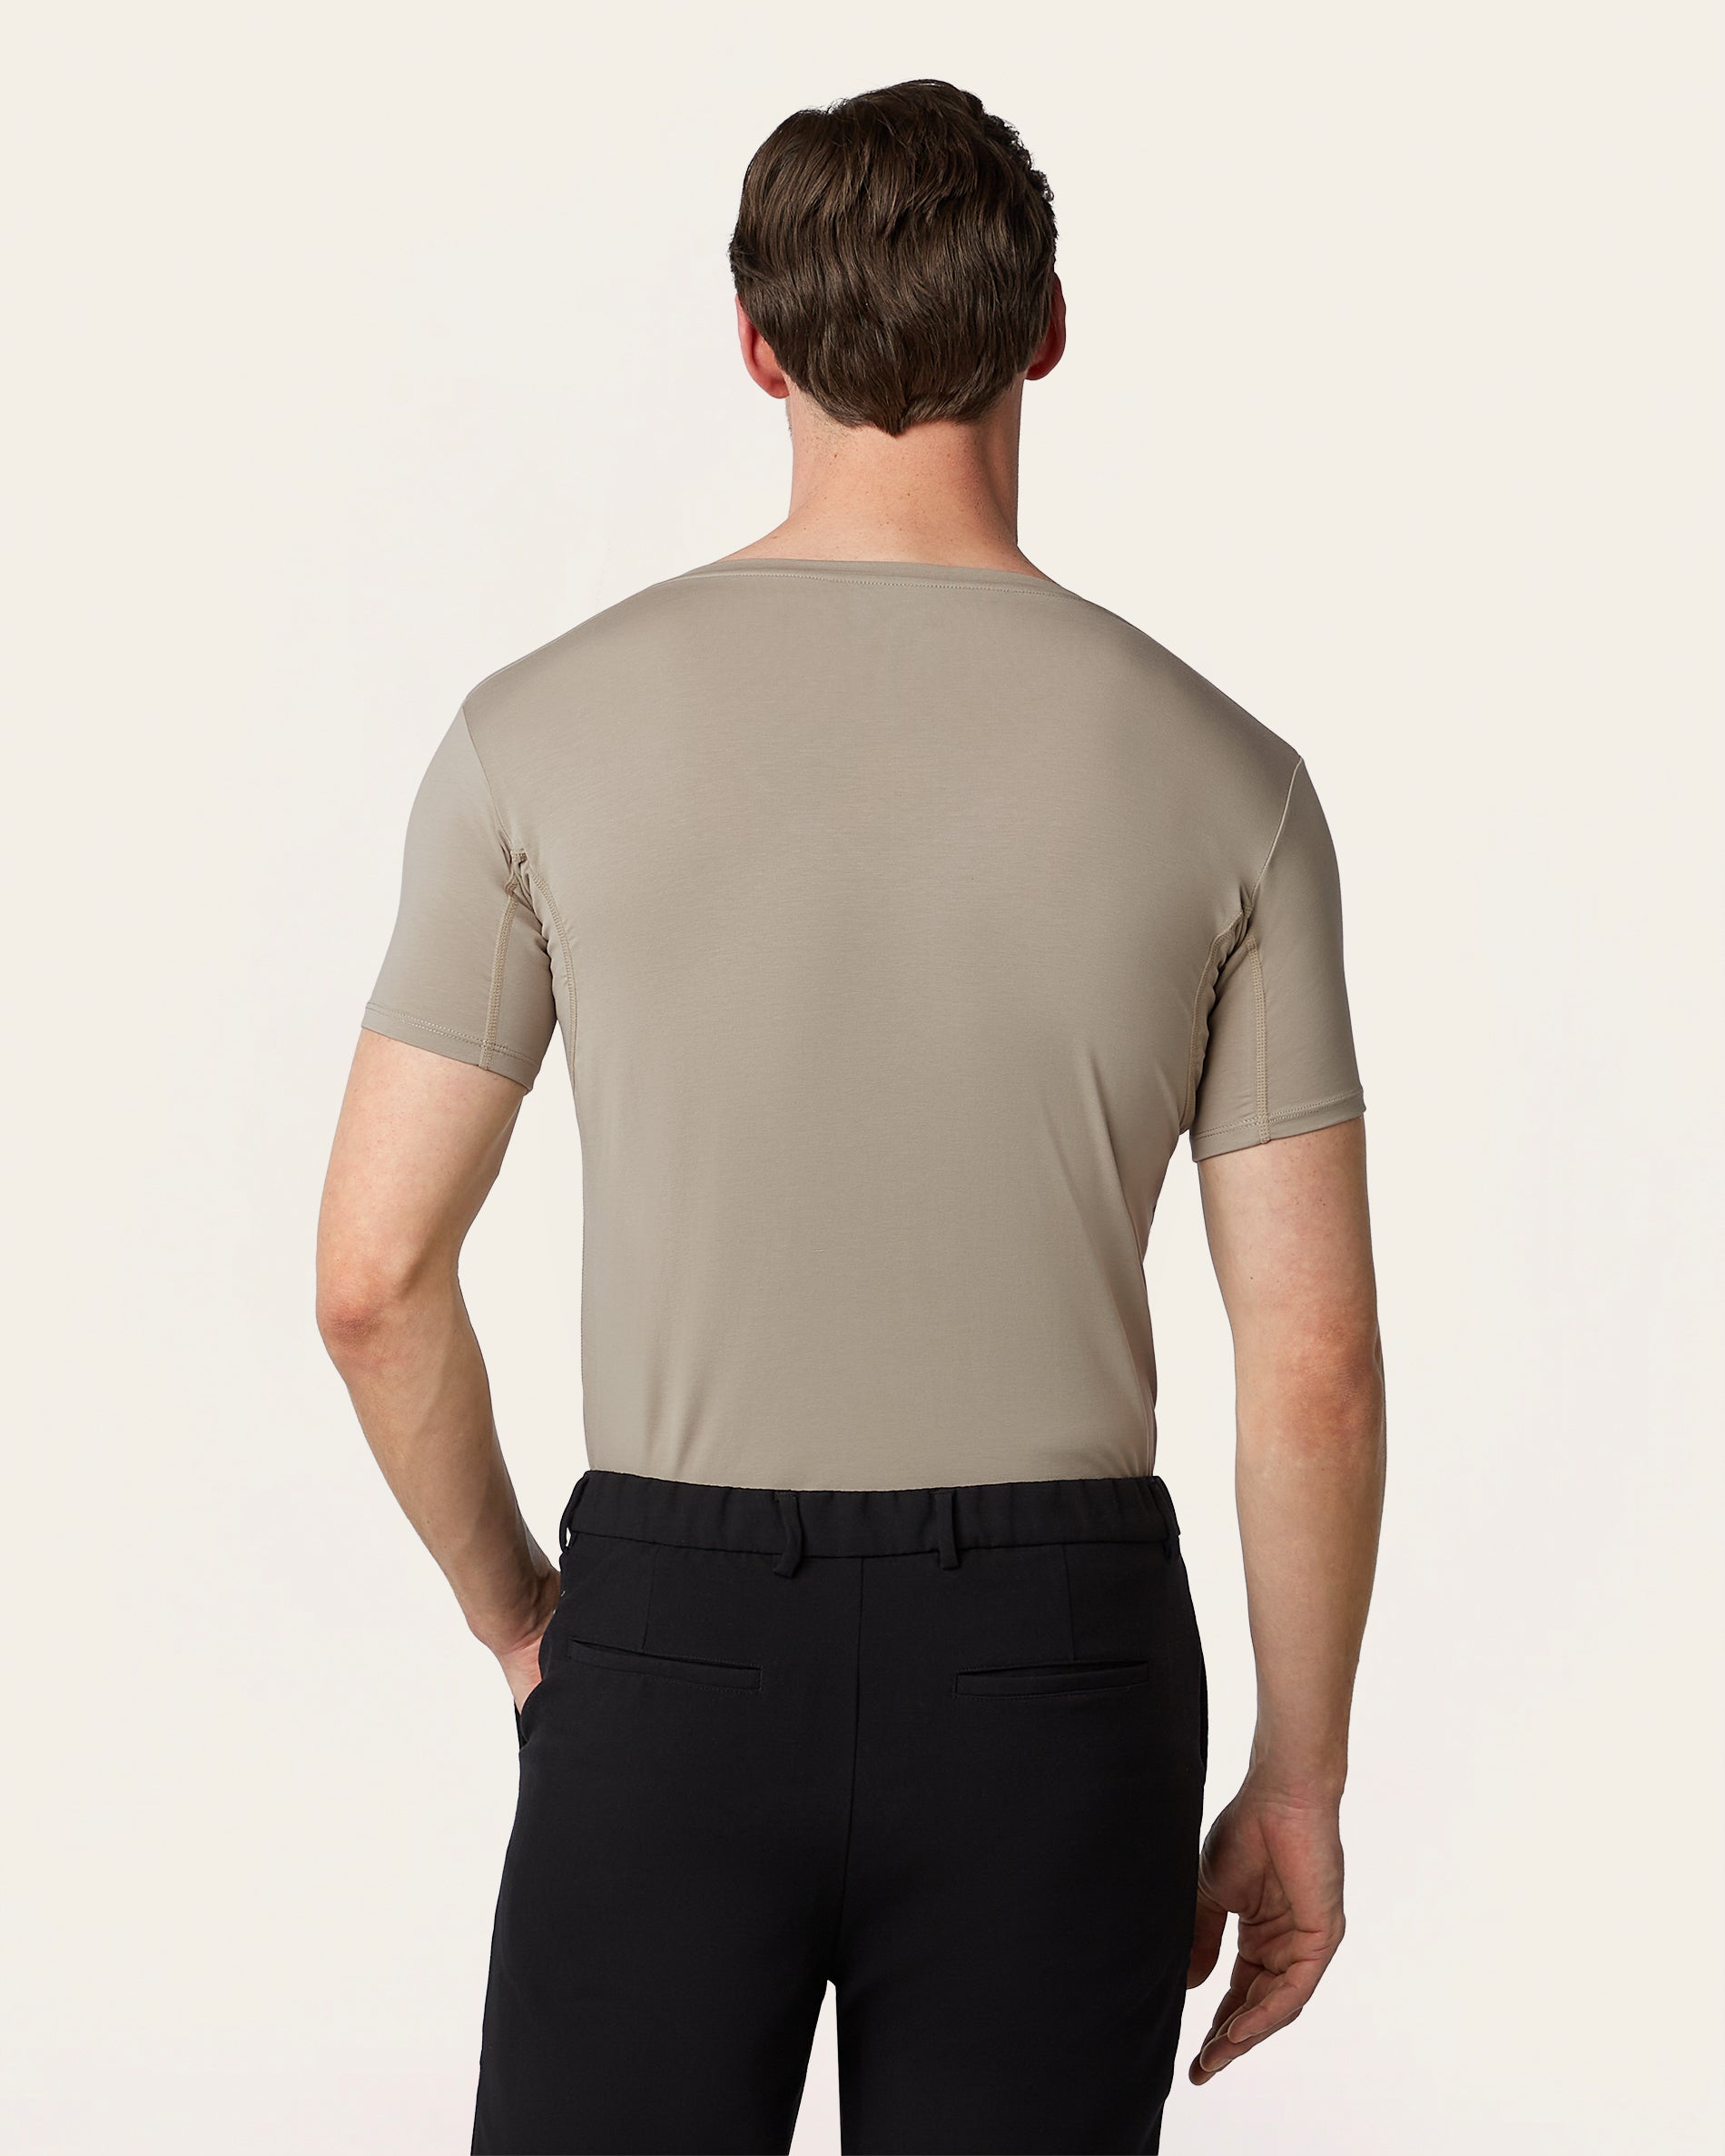
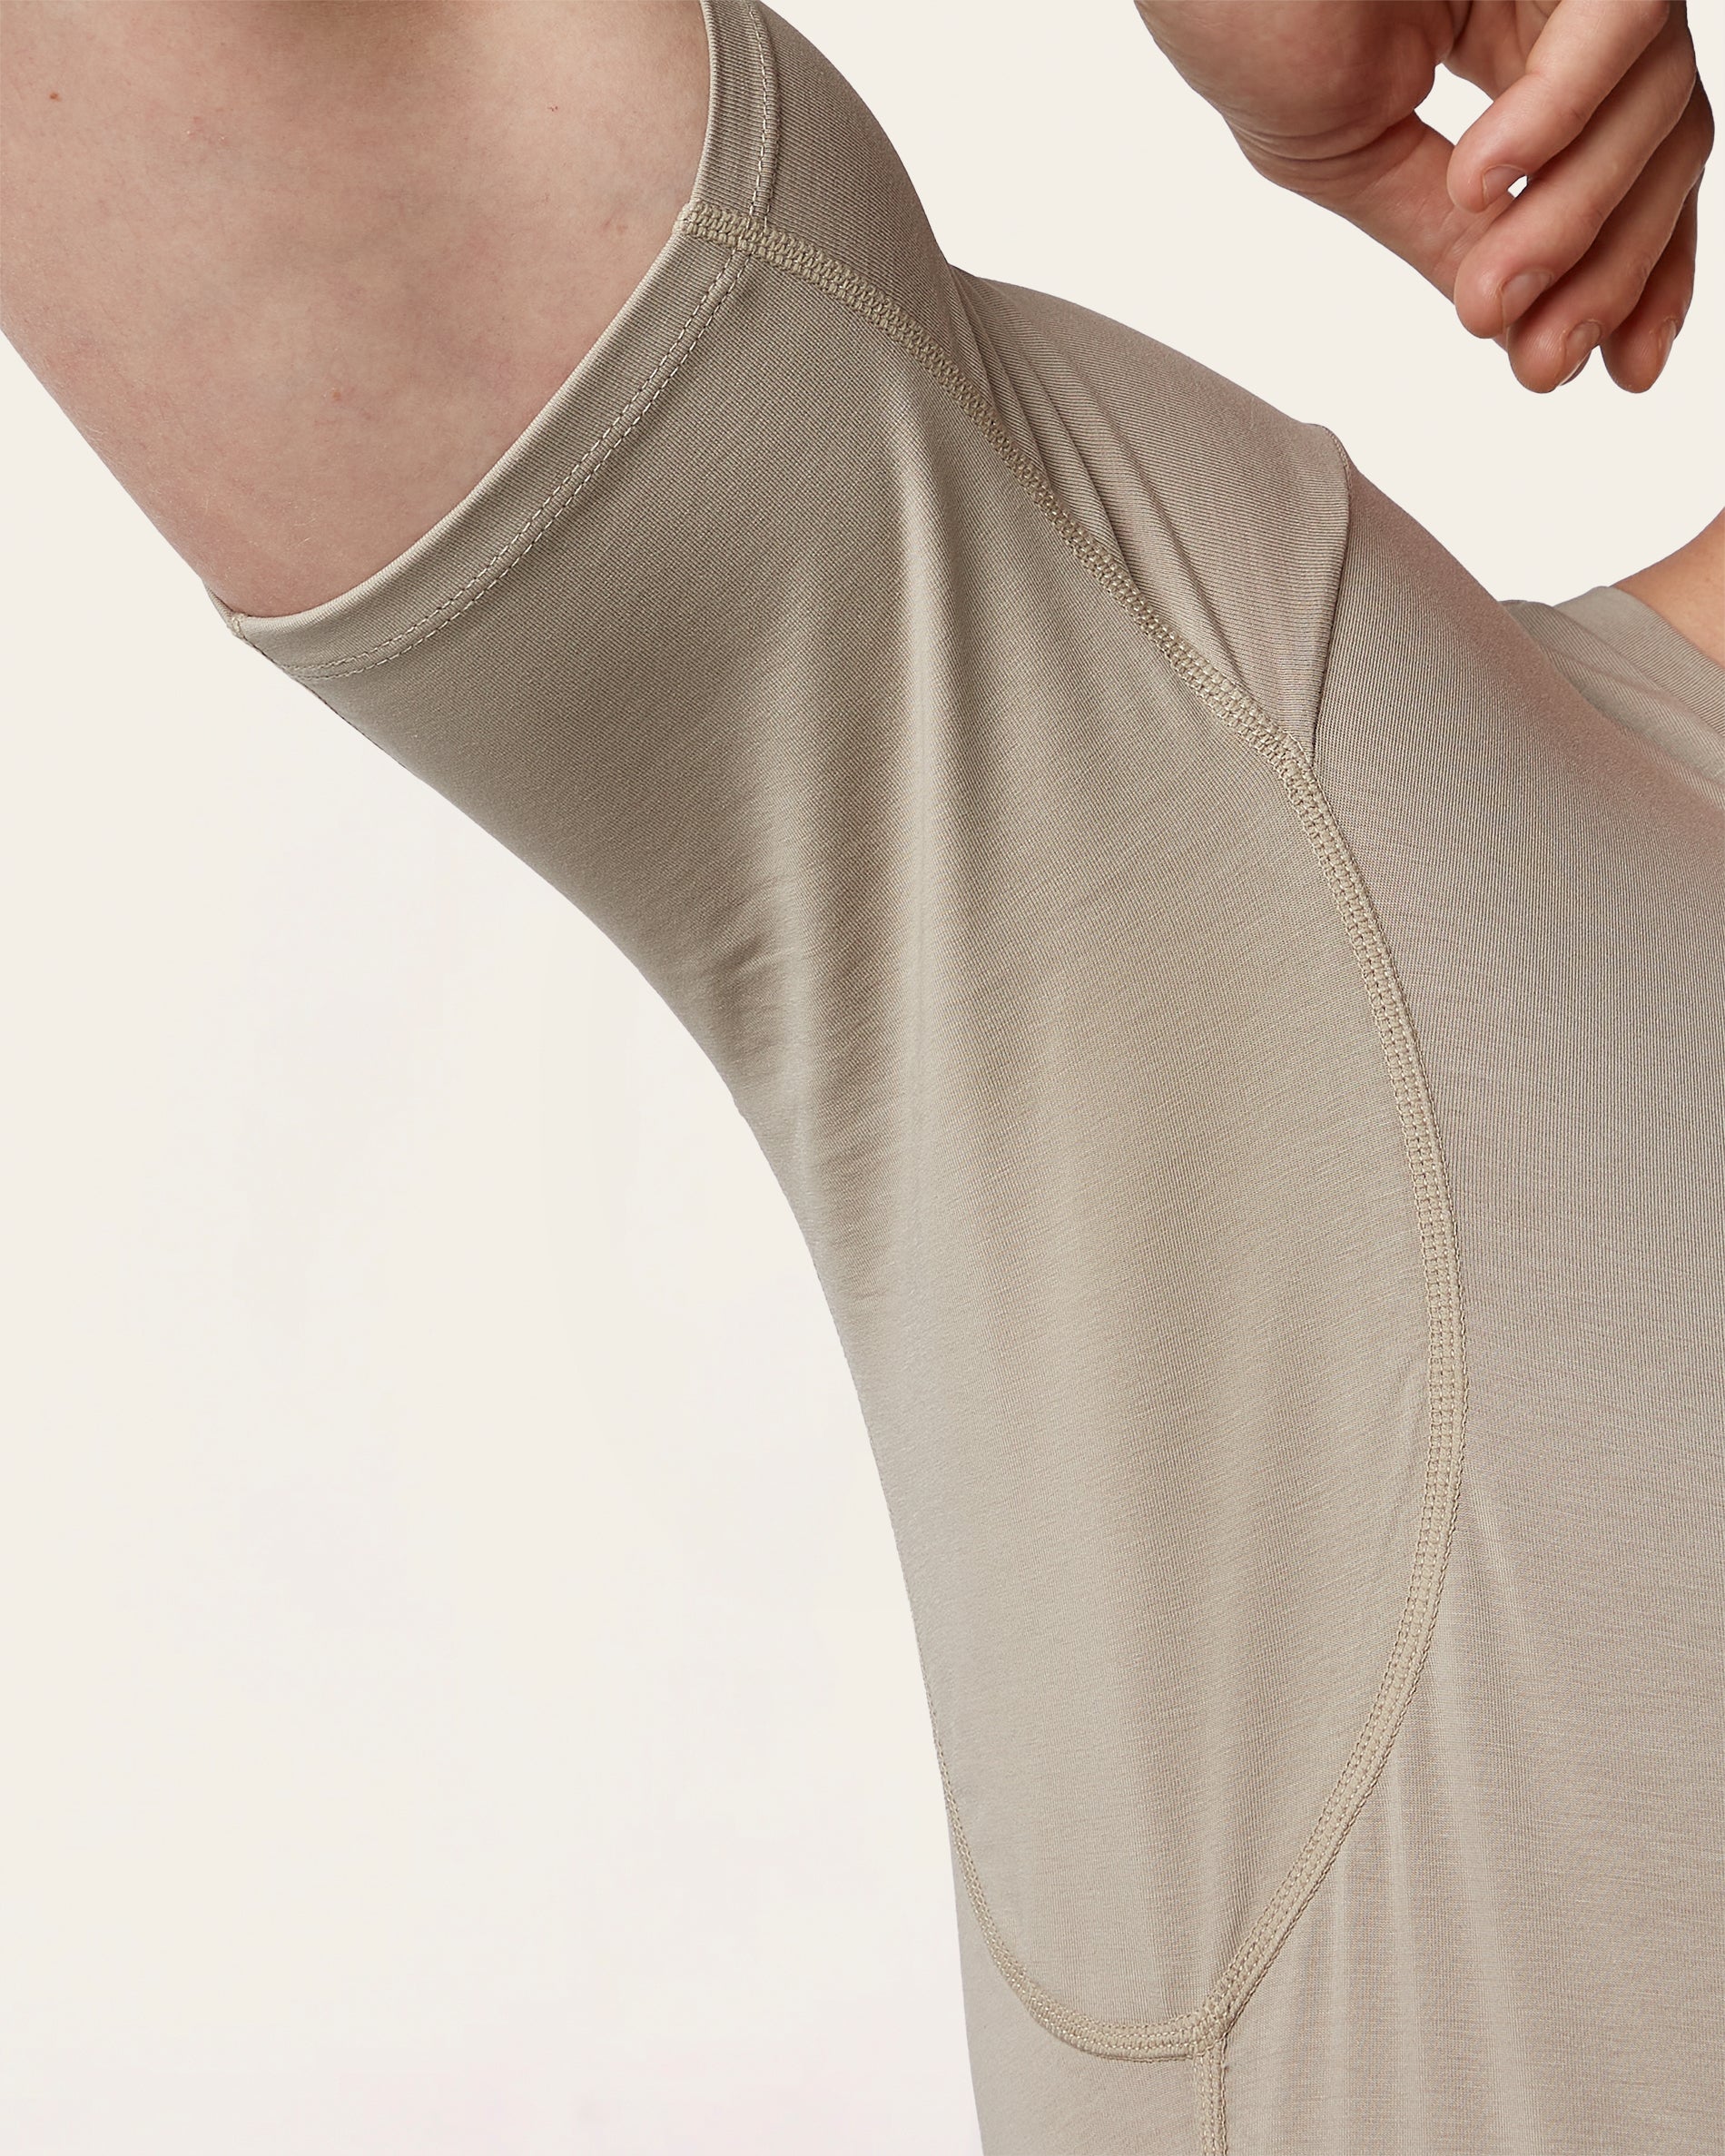
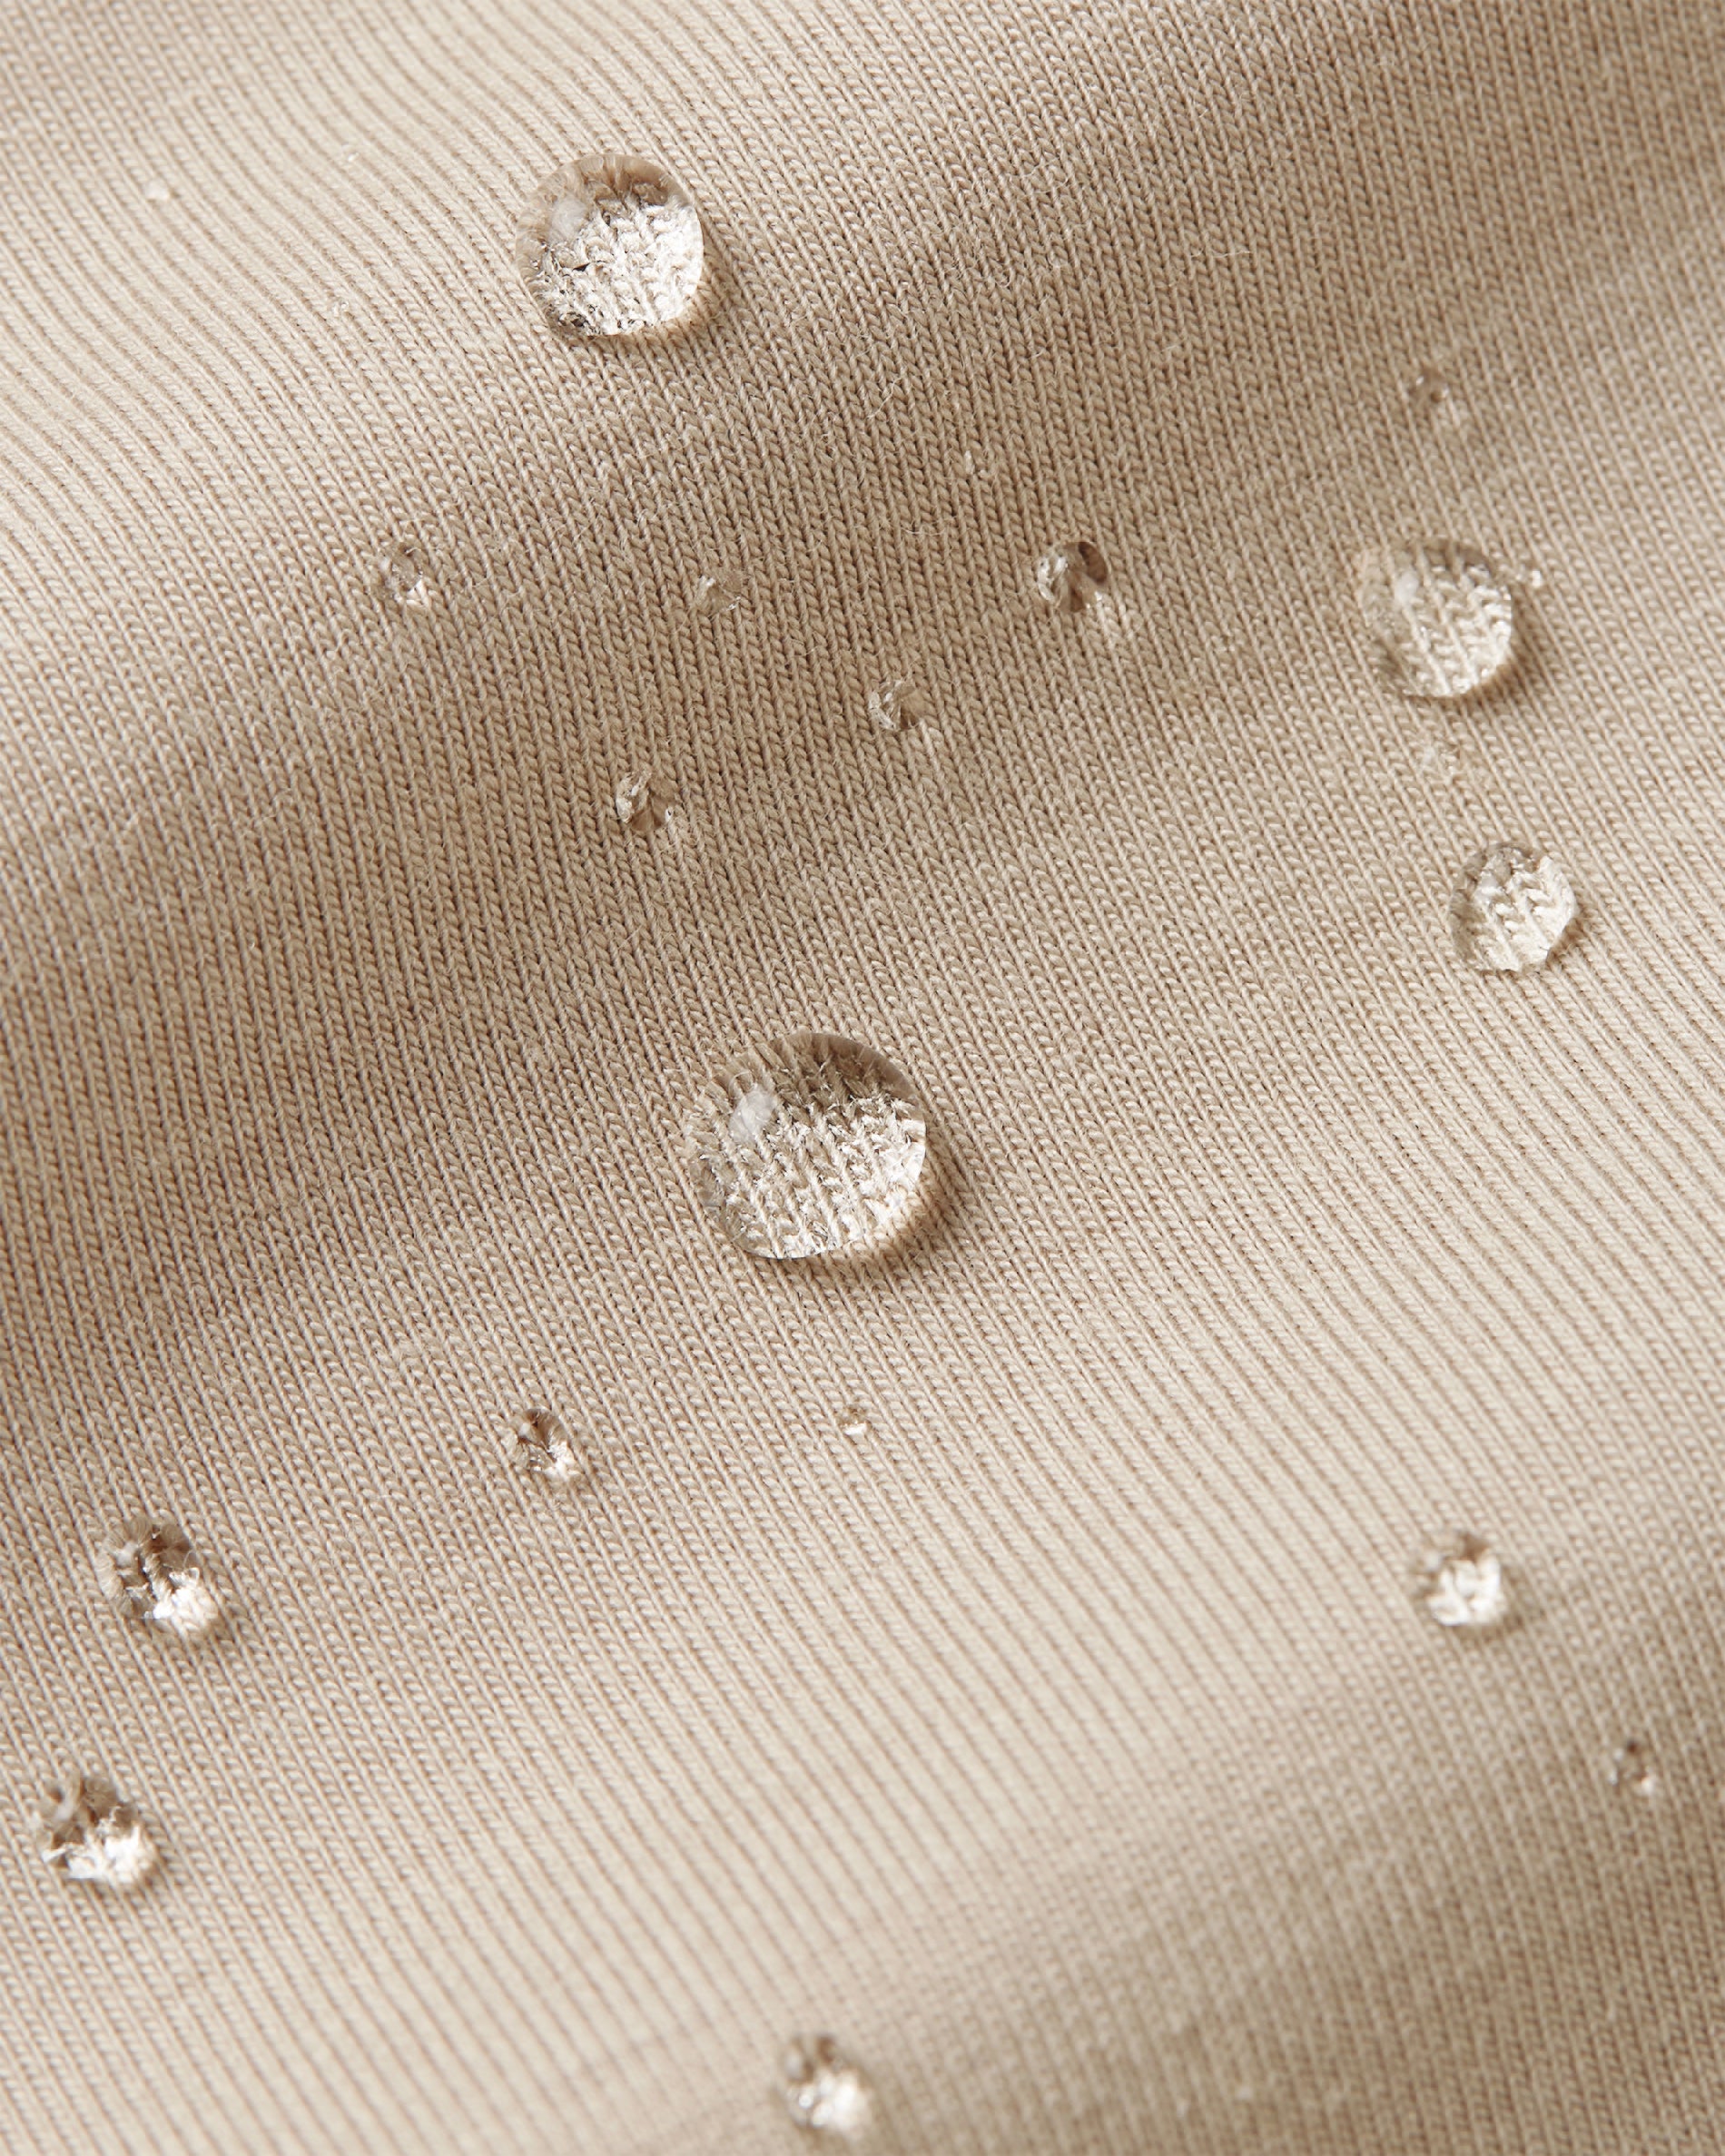
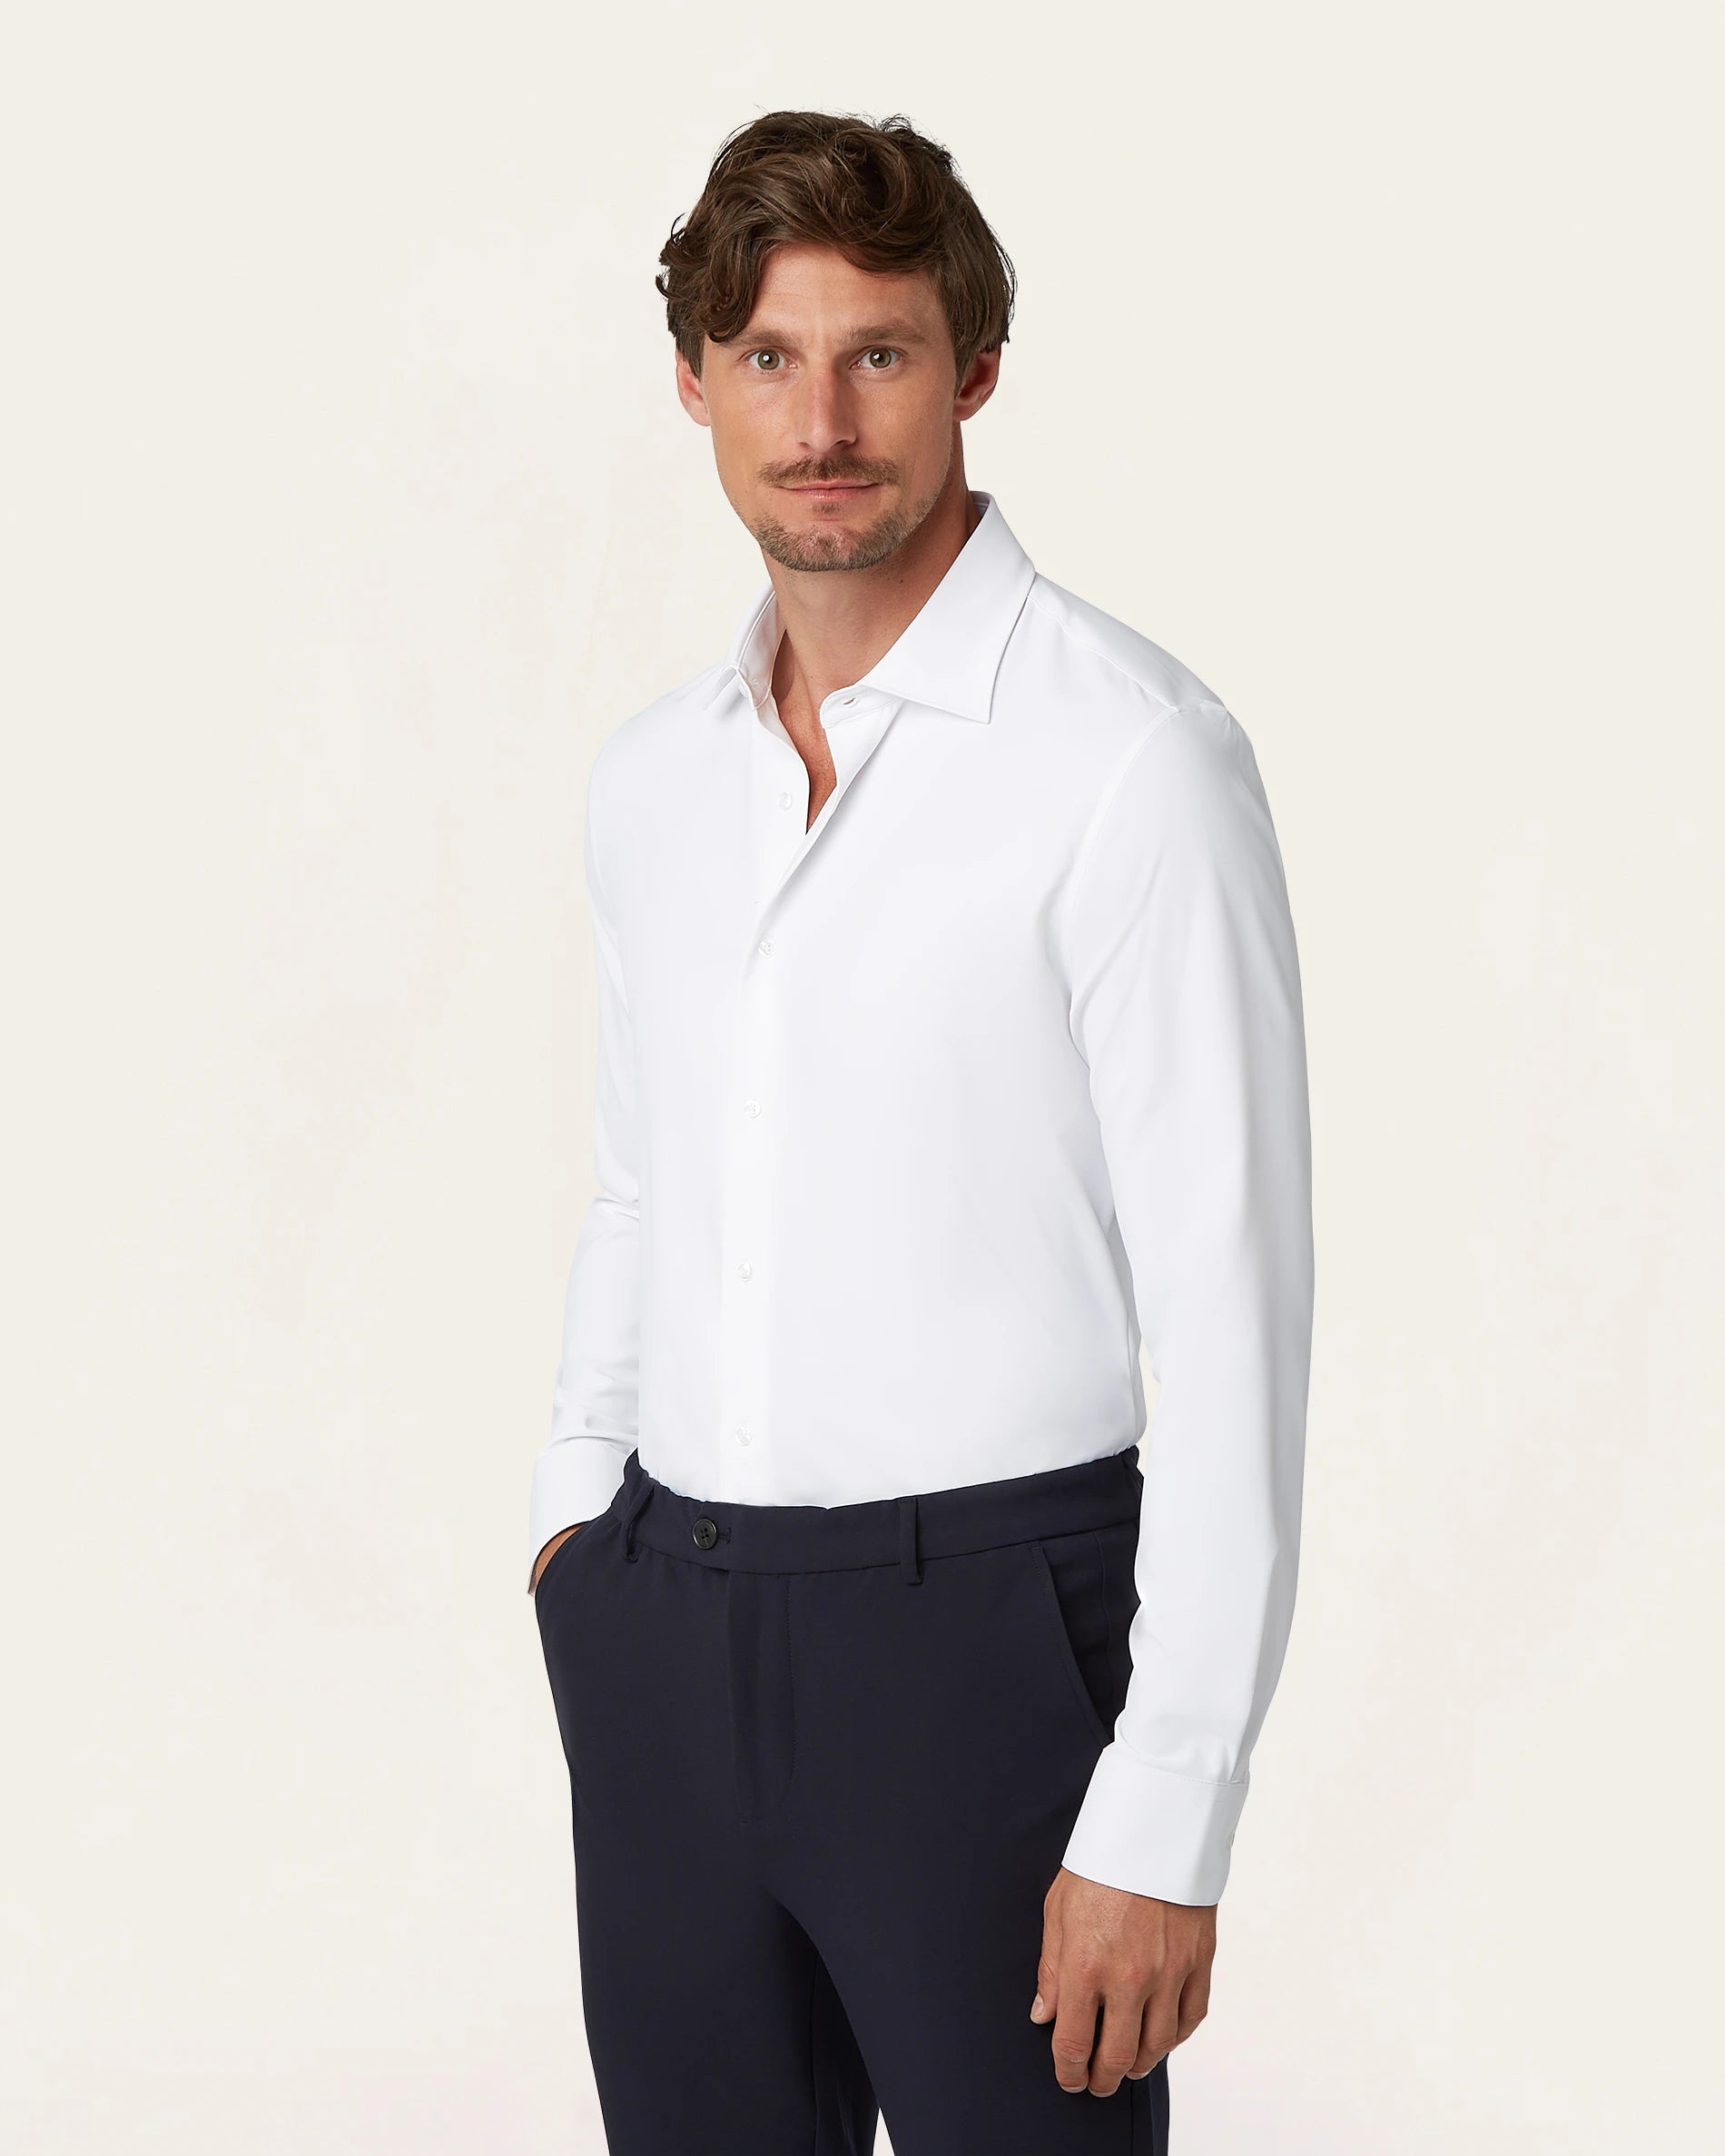
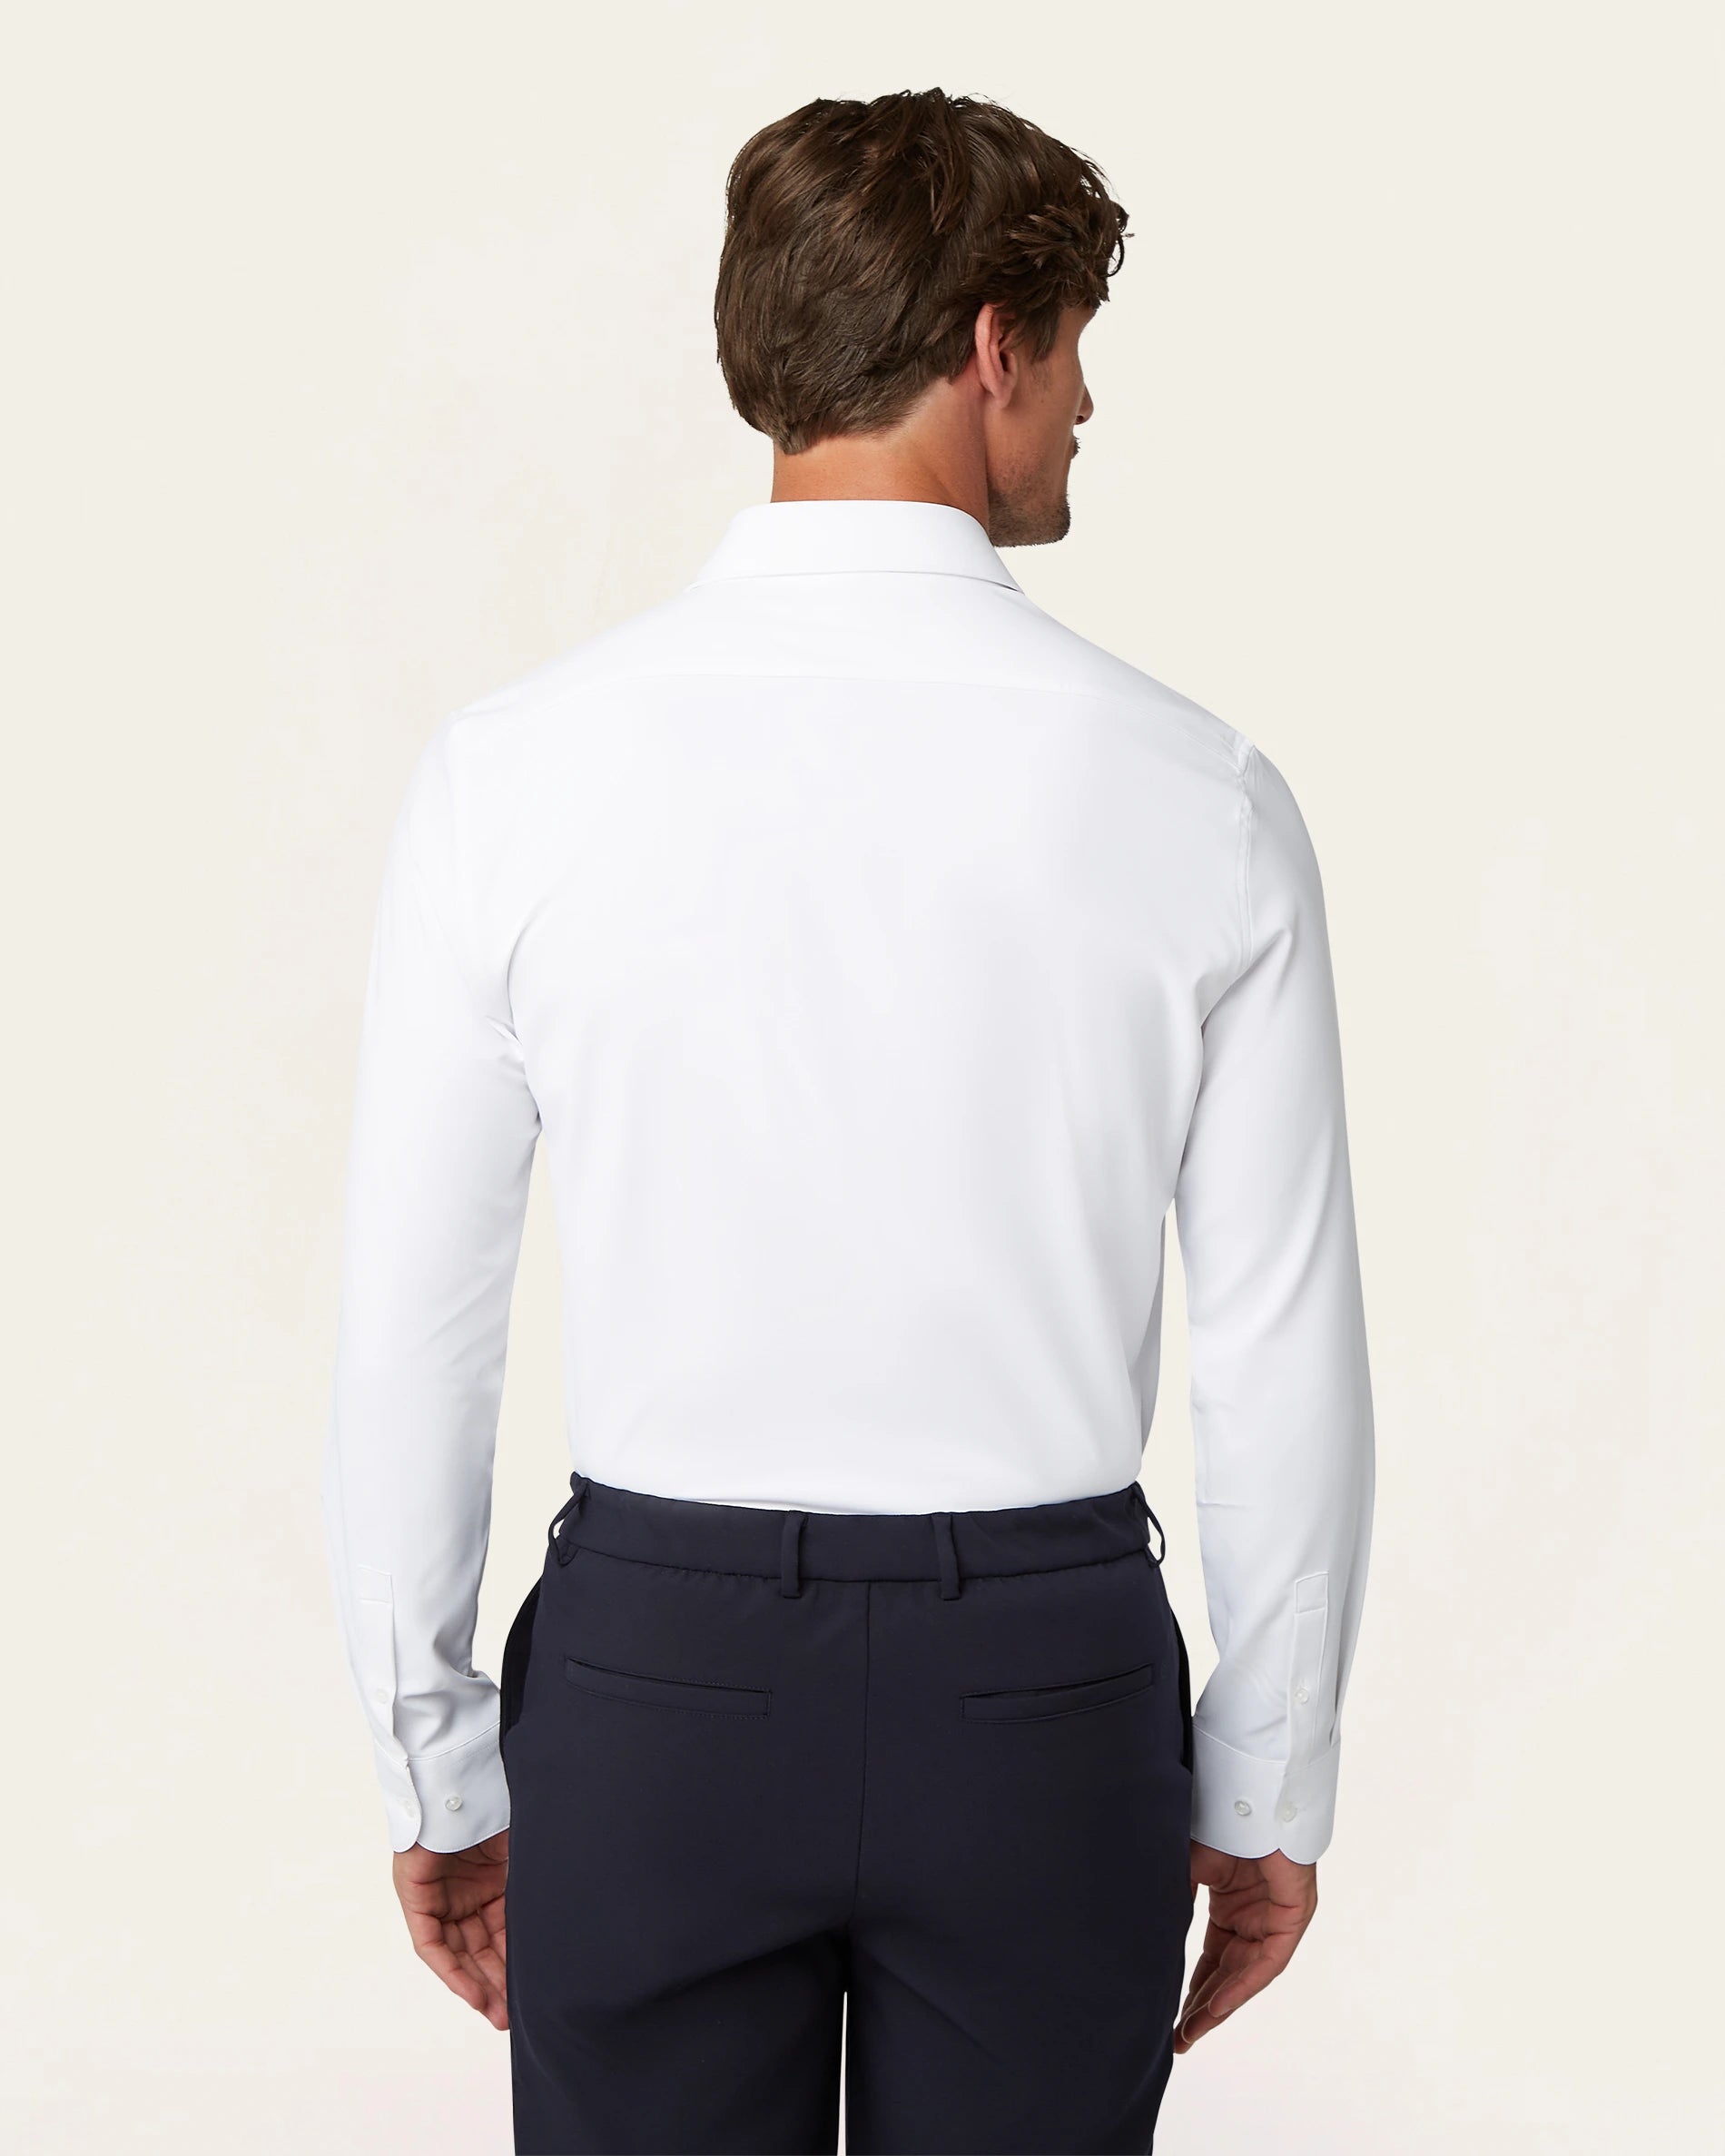
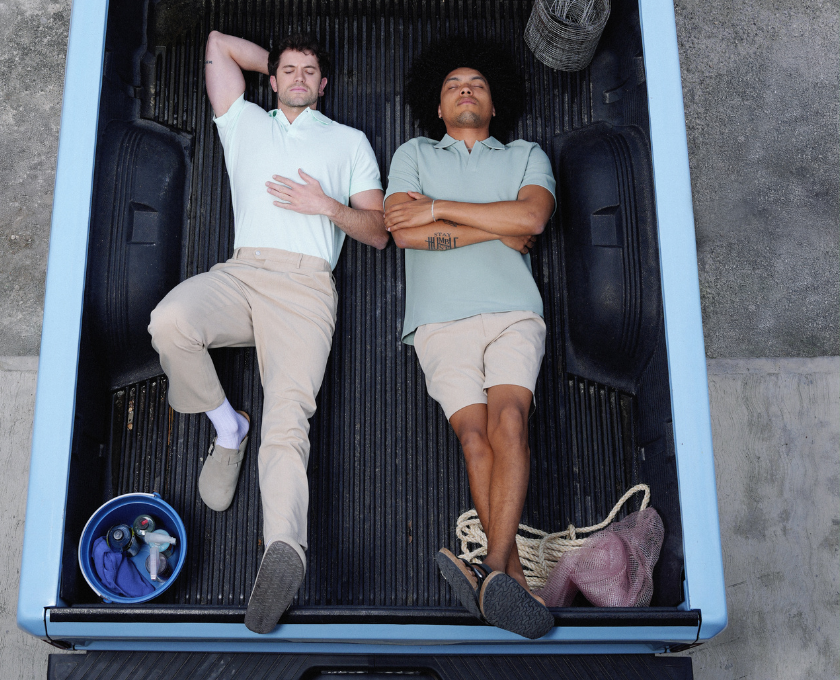
Sweat-proof summer classics
Embrace the heat
JOIN THE LAB
A loyalty programme worth joining
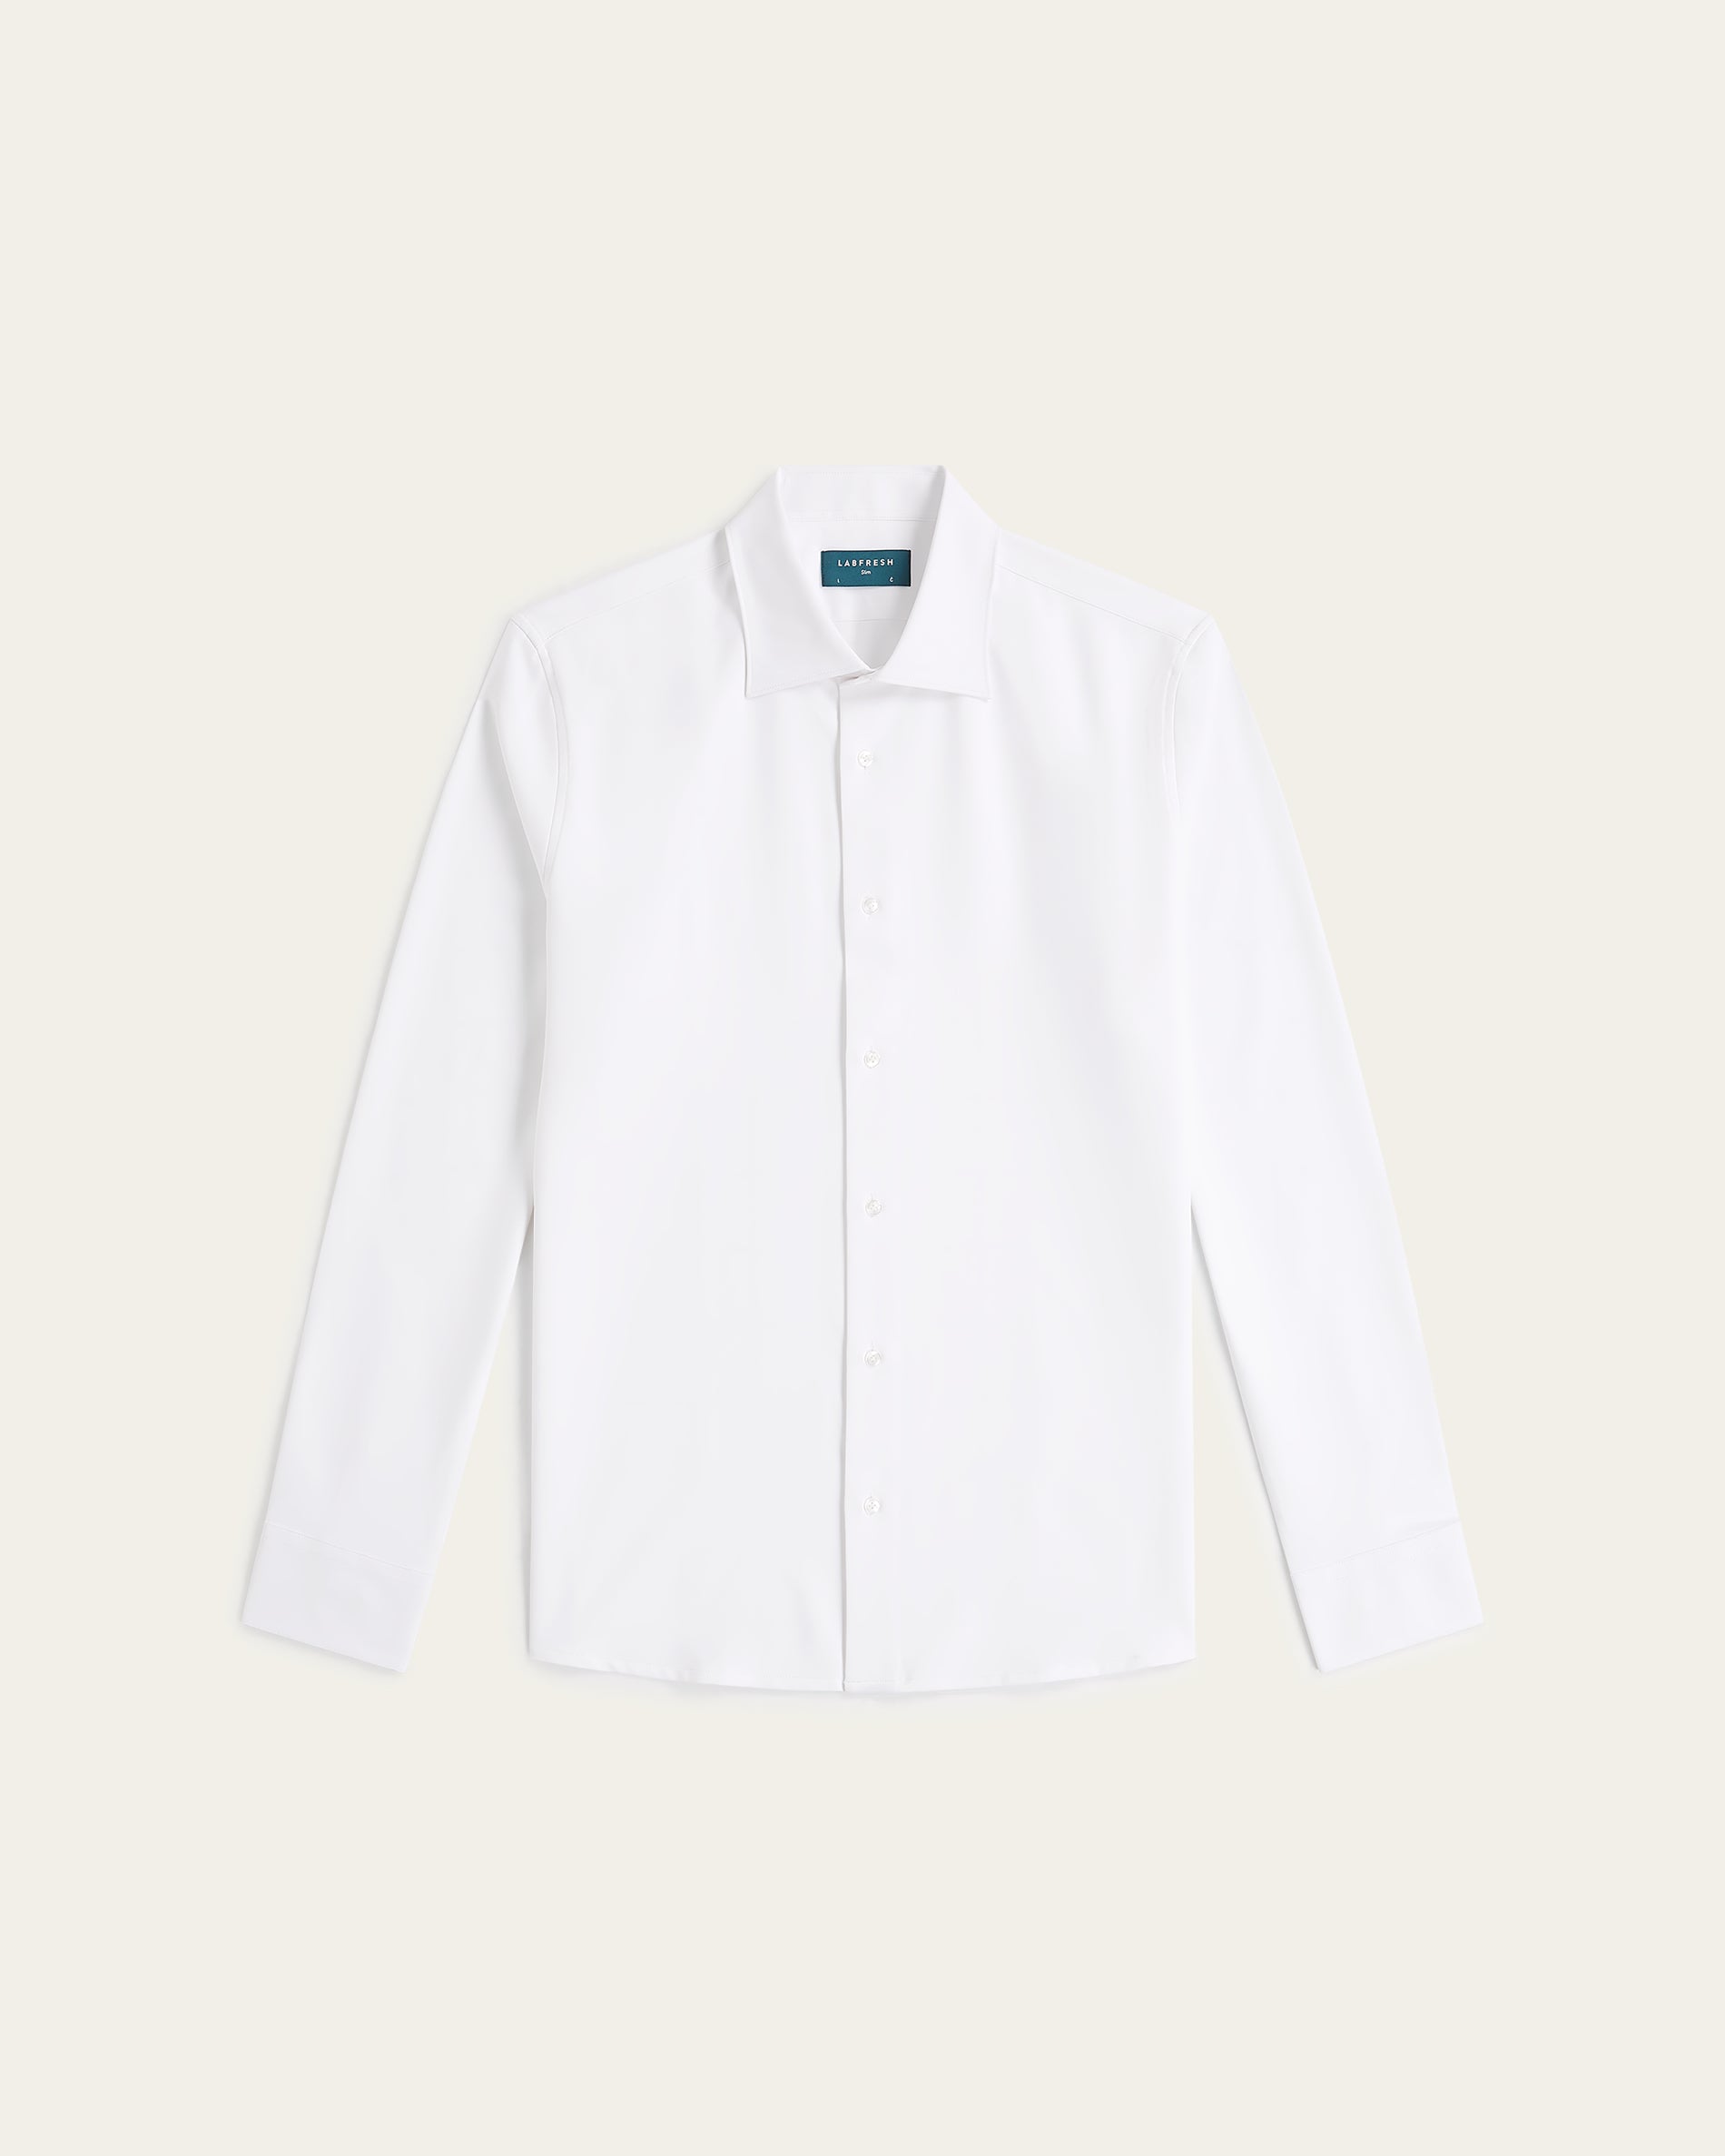
non-iron blouses
ULTRA SOFT BOATNECKS
SIGNATURE SUIT
Your cart is empty
Popular add-ons for -10%
Popular searches
Bestsellers